


Becoming a Better Fan Series: Phases of play leading to goals
with video examples! and charts, lots of charts

Part One Of Series: Regains and what happens next
Part Two Of Series: Settled Possession
If two triathletes finish at roughly the same time, but one gets there by winning the swimming portion and the other by winning the bike portion, wouldn’t you want to know that info before deciding which way to challenge them to a race? That’s broadly what we will be diving into here, except on grass and we aren’t wearing skin-tight lycra. At least I’m not. I’m wearing sleep pants with a laptop on my chest, eating Cheez-Its, laying on a yoga mat with Bayern-Real on in the background in what is, I admit, about as far from finishing a triathlon as you can get sober.
For a long time I have looked basically purely comprehensively at the game. Total entries, total shots, total yardage, efficiency, shot buildups as a whole seemed a better categories to look at in sum instead of splitting them even further into small samples…plus it was much easier to do so. And simplicity certainly has its virtues. As I’ve broken down games in more detail on this website and watched games more and more this year I’ve seen more and more teams dominate in transition or dead balls or both and kind of visually win the game more than it looks from the overall box score. As I’ve looked into regains and settled possession in the past two pieces in this series (see links above) and noticed the team differences in those phases of play, it’s just gotten me more interested and sure I need to break analysis a bit more up by phase of play. We want to have a smaller suite of numbers to see how well a team plays in the different phases.
It will be a bit of trial and error to find and refine phases, there might be overlap, there might be some play that is sort of uncategorized and I might add more phases later. It’s a process of building an argument, not a final statement here.
First my broad plan for phases of play
-dead balls
-settled attacking possession
-regains/scrambles/second ball
-transition play
Definitions
-Dead balls are the 3 actions following a free kick, corner or throw in. This constitutes 31% of my rough xG number.
-Settled attacking possession constitutes all play where a team has held the ball for 12 seconds or more and has the ball in the final 30% of the pitch vertically. Chances created from this constitute 31% of production.
-Transition means an attack starting 50 seconds or more from goal and getting to a shot or very deep touch in 11 seconds or less. I once read this definition from I think Matthias Sammer in Pep Confidential and figure it’s as good as any. Transition makes up 23% of my rough xG total, but the finishing on these is much better than any other category. So that 23% is probably a pretty solid under-rating. There is probably a case to break this into offensive transitions where you’ve held the ball for a while before moving it forward, and defensive transitions where it’s all keyed from a win-back. Long-balls also sneak in here at times, which makes this category rich for further drilling.
-Regains are when you win a tackle, an interception or a ball recovery and the 5 actions immediately following that. This makes up 8% of production.
-Rebounds make up about 3% of production but we won’t be focusing too much on those here.
There is some small overlap in these categories though I tried to get rid of most, leaving about 7-8% of shots that are not in one of these categories.
Let’s look at the teams to see if any of this theorizing makes sense in the cold, hard, unsparing light of a white-backgrounded Tableau Workbook.
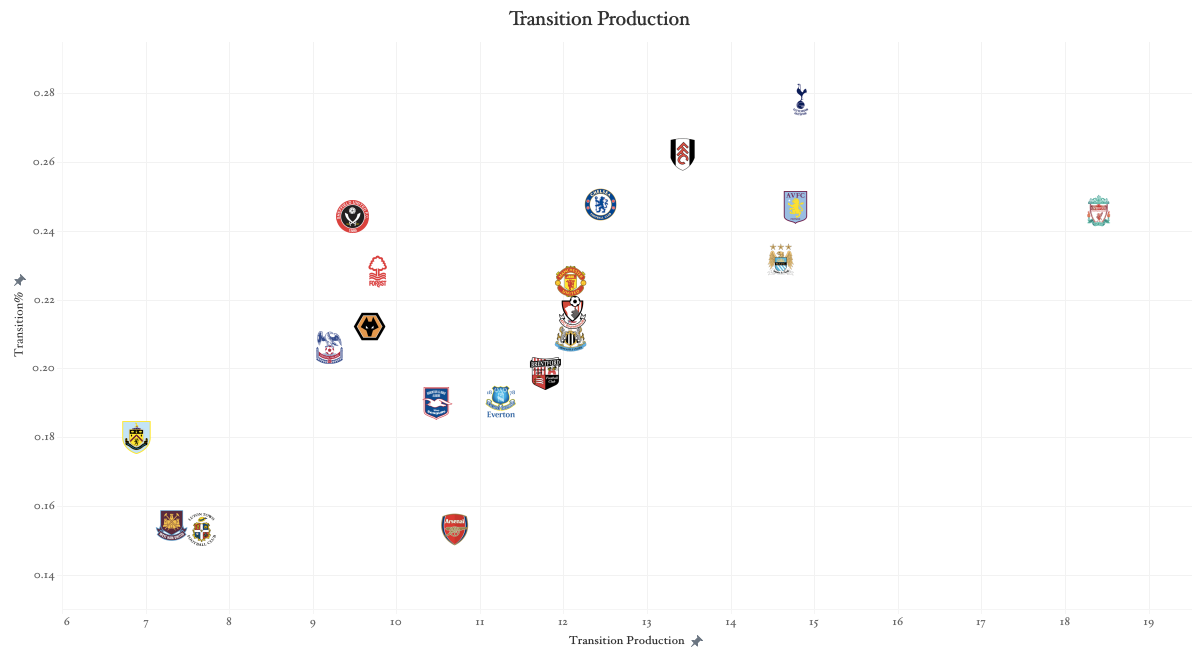
While Liverpool are head and shoulders ahead of the field in terms of total production on transition (definitely passes my smell test), Spurs and Fulham top them in terms of % of total production that comes on the break. Villa and Chelsea are also high there.
It is interesting to note the difference in Arsenal and City here, Arsenal are dead last % wise, while City certainly don’t seem to turn down breaks.
West Ham were known as a countering team under Moyes, but that seems to be an outdated stereotype kept alive by the Brighton game this season where they scored several great counter goals on a very few counter chances. They have been second last in total production on the break this year.

City have allowed a bit on the break, no one has allowed a higher % of their total production against in this phase of play, but totals-wise they are still second lowest. If Arsenal win the title, it could be small margins like this where they are just a bit better stopping transitions than City are.
The teams who are very open to attack are not surprising: Burnley, Brighton, and Villa play a style inviting this on. Newcastle’s defensive collapse this year was probably more injury-based but is undeniable. Manchester United have been cut open a lot in transition but they just give up so much in every phase, it doesn’t necessarily stand out. They are in that line with Luton, West Ham and Sheffield United. Not good neighbors to have if you are Manchester United.
What does it look like when a team that years for transition plays a team that leaves itself open to it? Click here for the example.
Liverpool vs Burnley had a few nice examples of it and can cement what these transition chances look like.
Note Brentford so low in the %’s, keep that in mind for the next chart.

Palace might be changing now with Glasner taking over but under Hodgson they were dire in settled possession. Everton do not want to play this way at all. Liverpool don’t really but have such a strong attack that they kind of wind up quite high on this list by default.

City and Arsenal are right on top of each other here if you, like me, went looking for City immediately. The linearity is quite strong in this metric. Maybe that suggests basically stopping settled possession is the broader skill and skill at breaking up opponent moves in settled possession is harder to distinguish.
Brentford seem clearly to want to force opponents into this situation and stop them from scoring any other way. No team has allowed more final third touches than Brentford this season, not even Sheffield United. Almost feels like a strategy to slow down opponents.
What it looks like when a dominant final third settled possession team plays a team that sort of funnels opponents into that? Well, you probably know but here’s a few examples: City v Brentford

Moyes relied more and more on set pieces as the counter fizzled out and West Ham are never going to have the numbers for settled possession or regains, leaving this basically as a way-too-crucial part of their offense.
Arsenal take advantage of set pieces to get production out of them, City, Chelsea and Spurs do not. A really low share and total for all 3 of those teams, who get plenty of set pieces and have some weapons to attack with their head. You wonder with Spurs and City if it’s just keeping the ball for more control.
Brentford and Everton seem like teams who know how to optimize their attacks that generally lack truly great open play magicians.

Tottenham’s set piece defense is the single biggest outlier from all of these charts in terms of % of any single phase for or against. 42% of goal threat production comes via set piece, which is way way above anyone else. Their set piece total is almost highest in the league, only a historically awful Sheffield United who have conceded 61% more final third touches than Spurs.
Spurs vs West Ham Set Piece Chances
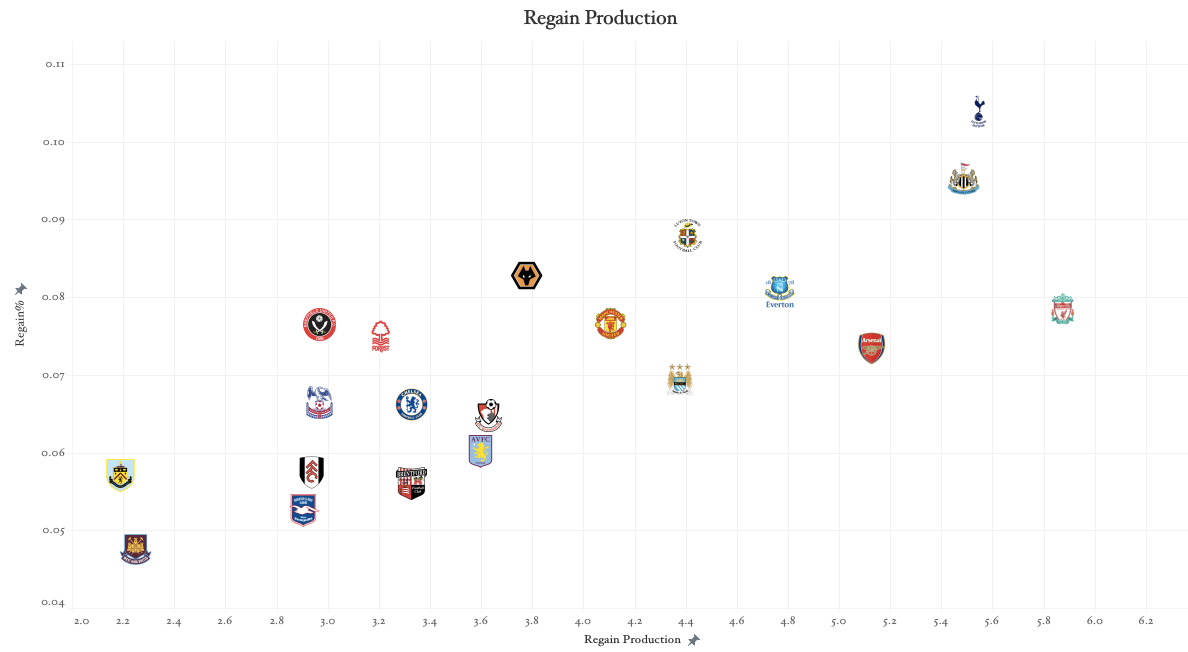
Brighton have conceded more regain production against than any other team.
Team -Wide
Let’s look at a few ways we can combine all this data into one chart.
First we are looking at totals.
I am thinking about removing rebounds, they are such a small% and feel a bit more random than the others.

Liverpool are very good in set and solid in settled possession but their best in the league attack is fueled through transition and regains.

Brighton’s defense looks strong against settled possession and set pieces but is below average in transition and then near the worst in terms of how many chances they give away directly after turnovers.
Next we will look at phases by z score. So this is more a % of the whole, and not raw totals. Not exactly sure if this one works but maybe can give you more of a feel for what the team really wants to do.

Arsenal do not want to play on the break at all, they purely want to hold the ball and grind you down by playing in settled possession.

Spurs defensively allow a tiny sliver, least in the league, share of opponent threat creation in settled possession. The share dominating all else is in set pieces, where their gap over #2 is just enormous.
Horses For Courses
Transition Merchants: Alejandro Garnacho, Son Heung-Min, Keane Lewis-Potter, Julian Alvarez, Marcus Rashford, Anthony Elanga
These players get a huge % of their shooting production on the break, from 42-50%.
Settle-ers?: Bukayo Saka, Phil Foden, Joao Pedro, Tomas Soucek.
Re-gainers: Anthony Gordon, Luis Diaz, Hwang Hee-Chan, Brennan Johnson
Rebounders: Mo Salah, Abdoulaye Doucoure
So, now we know how Liverpool, Spurs and Arsenal run their triathlons.
I think this will help when looking at a game and preparing for a game. Knowing what type of attack or defense the opponents are good at or bad at or want to force you into will be helpful. Most people who have watched Brighton all year know that they have an unfortunate tendency to give up shots and goals off high turnovers, here we have solid data to show that. Spurs set piece defense stands out here basically with alarms going off if Excel had that function. Knowing how reliant Liverpool are on breaks is something most fans know, but you might not know if looking at a new league or team where a new recruit is coming from or are your opponents in the Europa League knockout stage. I’m excited to use this to build team profiles at the end of the year.
Let me know what you think in the comments, whether the categories fit or should be expanded, changed, detailed, or if this way of looking at things is totally off-base.