
Player Report: Casimir Ninga
After the massive undertaking that was poring through the new treasure trove of StatsBomb supplied data at FB Ref, I wanted to hone in on a few players who caught my eye and try a few comparison tools out.
First off, here are the total team recaps I wrote
First up in the player profiles is Casimir Ninga of Angers.
Age: 26
TM Value: 2.4 million.
Position: FWL
Nation: Chad 🇹🇩
Contract Until: 2023
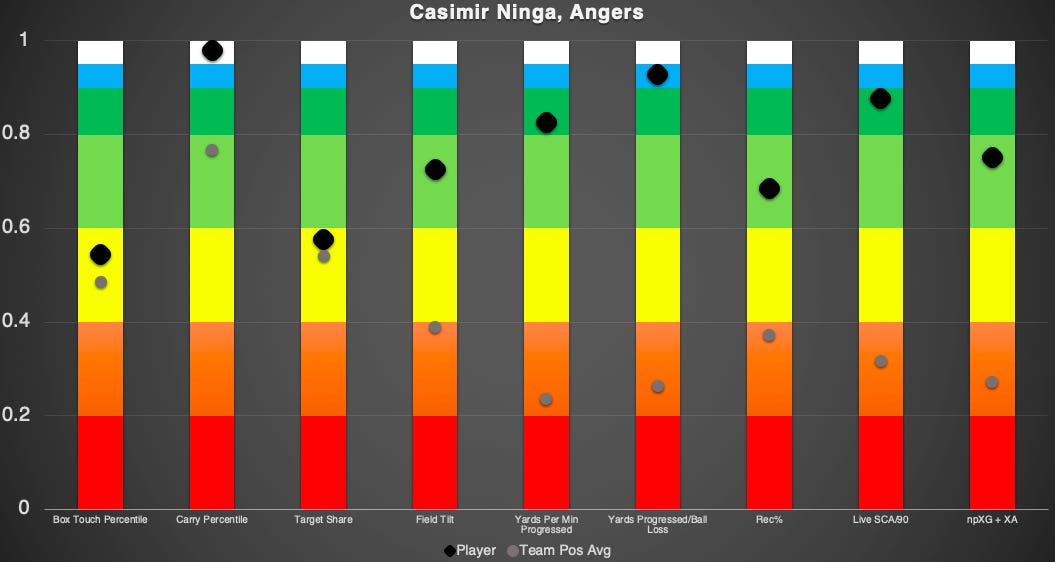
The Comparison Chart
Recap

Ninga is above average at every category I've charted here, leaping into the blue Excellent range in efficiency of ball progression, and the top 20% in yards per minute and live shots created. All this coming against a background of the rest of Angers forwards looking quite mediocre and a team that has scored 1 goal per game is encouraging.
The cons are he has not held down a starting role on this team, racking up just 677 minutes and his previous two seasons he produced half of this xG total, when at Caen and Montpellier. He hasn't shown this kind of progression skills in previous seasons but it is on the upswing, from 1.7 to 2.9 to now 3.2 yards per minute and a yards per ball loss from 12 to 20.5 to now 25.5. The constant progression there is encouraging, even as he has relied massively on his carrying ability, to an extent very few other players have as you can see by him reaching the snowy peaks of the white column in the Comparison Chart. Nearly 80% of his progression comes via the carry.
Ninga is not a prospect or a young player, but he is a player seemingly developing through the prime of his career. If the goal production can be maintained, he's a serious weapon, unfortunately 7.5 sub-heavy 90s isn't too much to go on there. The pitiful TM value and the fact that his move to Angers was just for 3 million indicates an enterprising, richer team might be able to swipe him for something under double digits, maybe well under that, for that price I'd dive in.
Technical details
I wanted to see how he stacked up to fellow players at his part of the pitch so I made these graphics. This chart is this player compared to all other players that have similar field tilt, no differentiation is made between wide players and central players. Field tilt is calculated by weighting touches in all parts of the field: penalty box, attacking third, middle third and own third to get a rough gauge on where the player is showing up most often.
The black diamond is the players rank, the gray circle is his teammates who occupy a similar spot on the field's rank.
The first two columns are basically purely stylistic, what % of a players total touches are in the box and what % of a players progression comes via carries.
The next one is about how often a player's number is called: target share is how often passed are played to him, relative to an average player on his team.
Field Tilt is how far up the field a players average touch comes.
The next two are often tied together, but not always. Yards Per Min Progressed looks just at passes and carries yardage gained per minute to judge volume of progression, the next Yards Per Ball Loss looks at that with a denominator of ball losses to judge efficiency of progression.
Rec% shows how often a pass intended for a player is successful.
Live SCA/90 shows how many shots are created from a players actions per 90 minutes.
And of course, the most important metric on this chart is the final one: np xG + xA/90 which measures total goal production by a player stripping out penalties.
The next two will often, but not always, be tied together.