Playing With The Powerful Pass Type Tool

I've used this many times before, the first time I dropped it in an article was I believe last January at StatsBomb. During the World Cup, I found it useful. Others like Devin Pleuler at Toronto FC and Paul Power, Xinyu Wei, Hector Ruiz, and Patrick Lucey of STATS have followed up on it with similar work. The fact it either caught on or they came to similar conclusions about the use of this tool makes me even more confident it's a great way to break down passing.
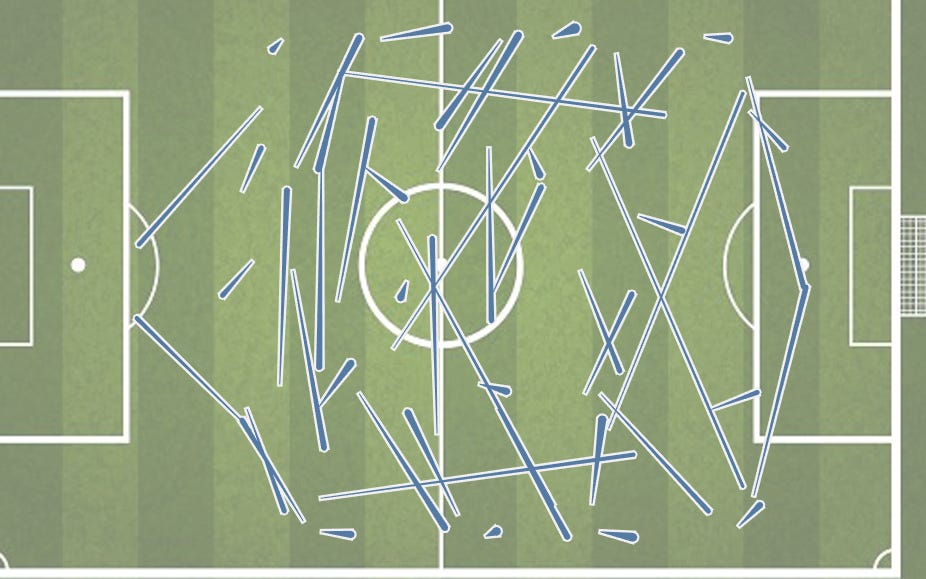
I take every open-play, footed, non-goalie pass this year and use k-means clustering to assign each pass to similar ones. I only use x,y data here because once you add more than that, I feel like you need even more clusters and eventually you lose simplicity. Here are the 50 pass types. Later we will work on chaining together pass types, one after the other to look at possessions and moves, which is what Devin hinted at but didn't give us measly peasants the goods in his presentation.

We will look at some basic stuff in this post before using this powerful tool to delve deeper as we go forward.
First, simple rankings:

Which teams play those 3 types of pass the most? The short, generally forward ball in the final third.
1. Barcelona (9.3% of total passes)
2. Man City (7.5%)
3. Valencia (7.1%)
4. Lazio (7.1%)
5. Watford (7%)
6. Chelsea (7%)
7. Bournemouth (6.5%)
8. Hoffenheim (6.3%)
9. West Ham (6.3%)
10. Liverpool (6.3%)
Which allow the fewest types of these passes?
1. RB Leipzig (2.8%)
2. Bayern (3%)
3. Man City (3.4%)
4. Eibar (3.4%)
5. Torino (3.6%)
6. Liverpool (3.6%)
7. Gladbach (3.8%)
8. Juventus (3.8%)
9. Napoli (3.9%)
10. Atalanta (3.9%)
Now we can look at each team to see a few of their pass type tics. We can set these maps up to only show us types of passes, say Liverpool play more and less often than average:

And then we can bring up Cardiff's to see a difference.

Guess what? Cardiff don't pass sideways or slightly forward in their own half much! They hit long bombs forward a lot!
We can do this in the Bundesliga, let's look at Dortmund.

And then their more vertical competitors in Leipzig. Square balls across the back simply aren't a part of the Leipzig offense.

We can do this with defense of course. Let's look at the differing defenses of a few of the Big 6.

Opponents wind up playing vertical down Spurs right side a lot and never spend much time moving ball horizontally across the middle of the pitch.

United see a lot of action on their right side, own half.
Liverpool aren't letting you get passes into the box, while Arsenal...
often do let you play a cross in from the right. Now again, this is relative % of total. Nothing to do with completions, nothing to do with raw number. You could have 70% possession and never allow completion, I'm just pointing out pass types.
To wrap up this intro, let's look at two of the most fascinating and stiffest defenses in club soccer so far this year.


This weekend's matchup in Leipzig will certainly be on the One Question Weekend Preview.
Hopefully this is interesting to you, if you want to see your teams map, just write me, comment, tweet, etc and I'll post it. Where will we go from here?
Chaining pass types together to look at possessions
Looking at who completes more or less than you'd expect of a pass type
Look at who creates more and fewer chances from a certain pass type
Looking at player maps and combos
The possibilities are essentially endless. Get ready to be snowed under by Tableau pass maps here on SaturdaysOnCouch.


